Summary
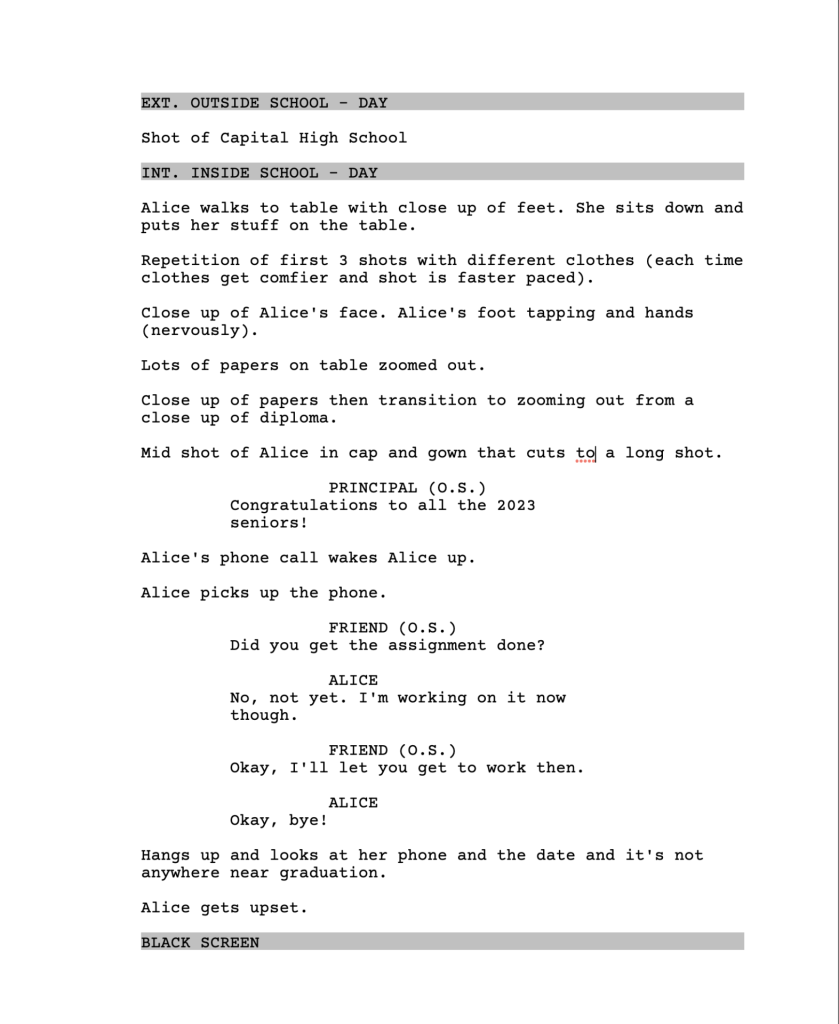
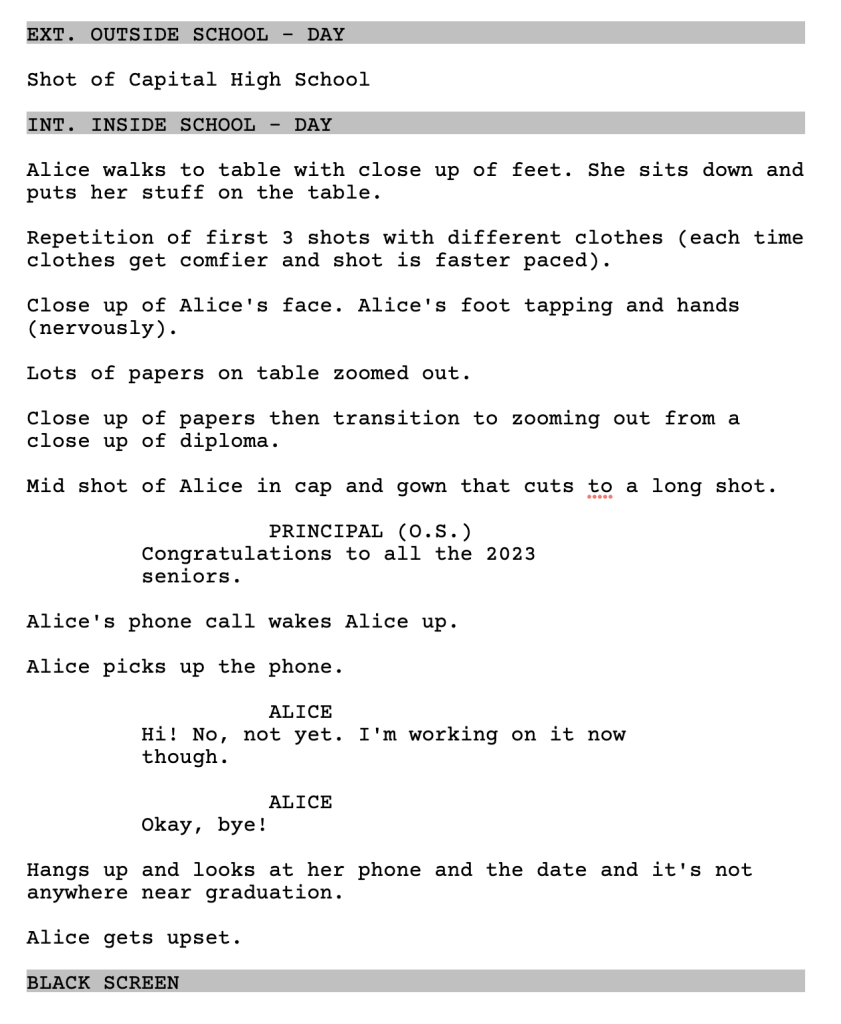
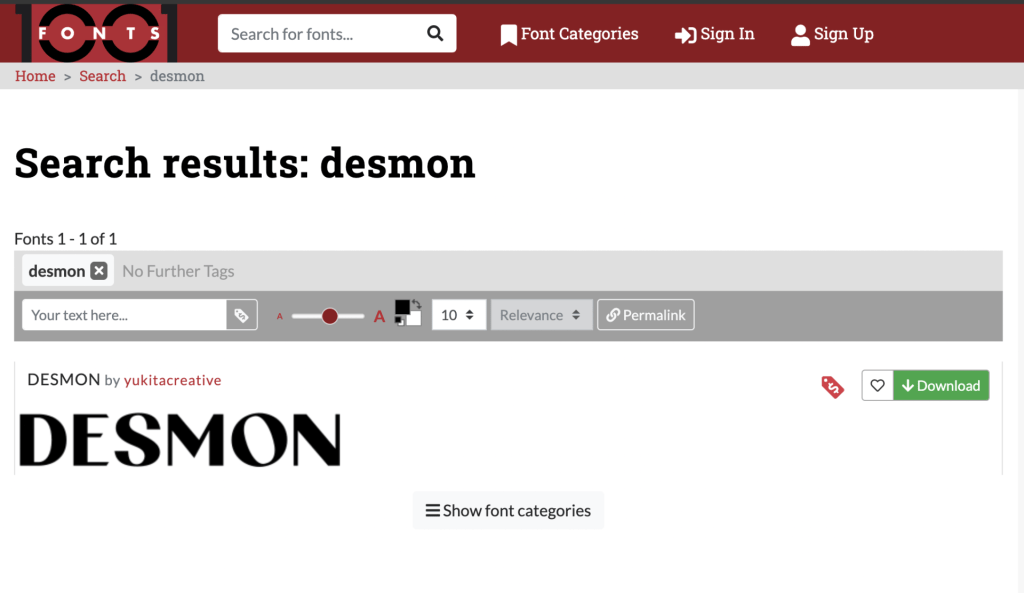
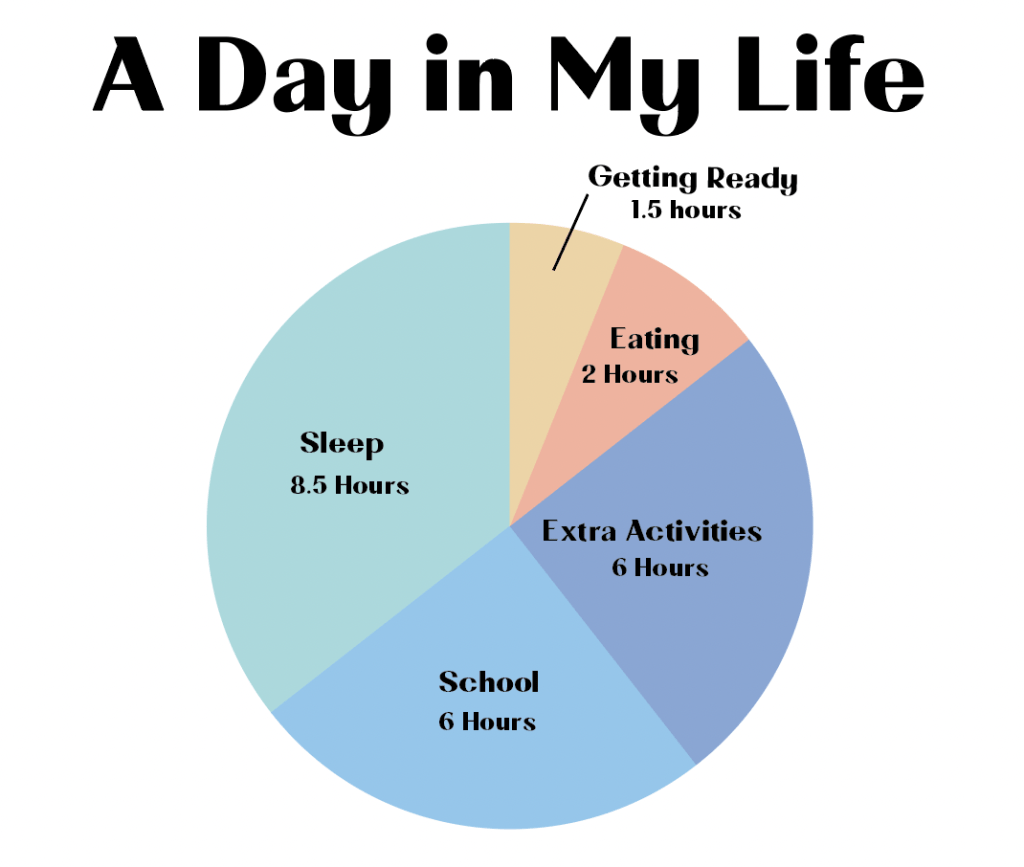
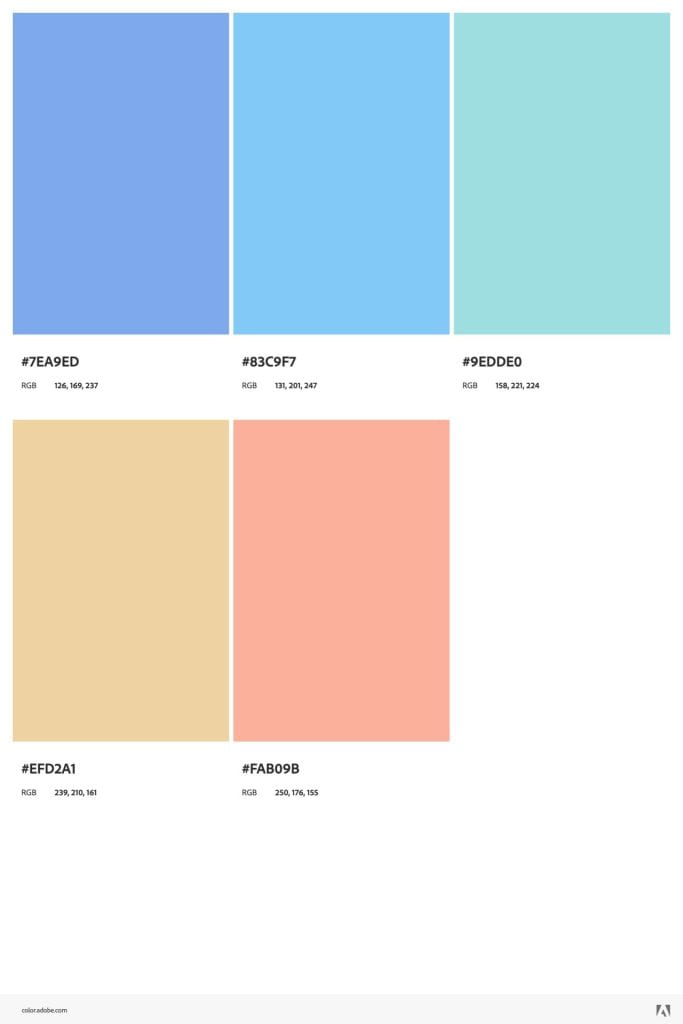
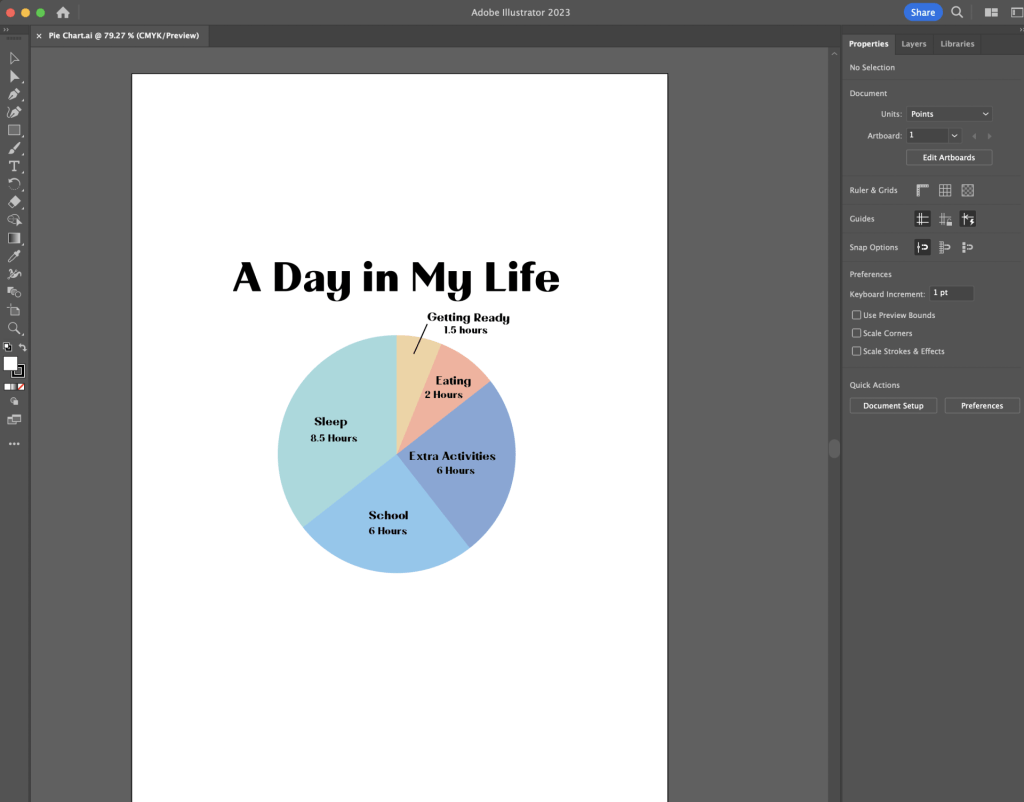
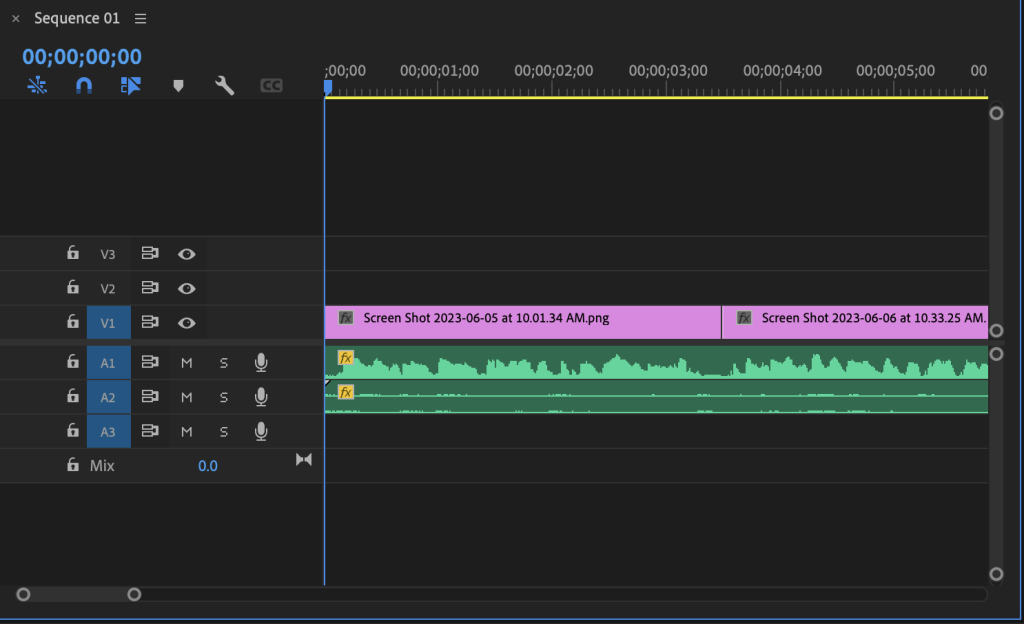
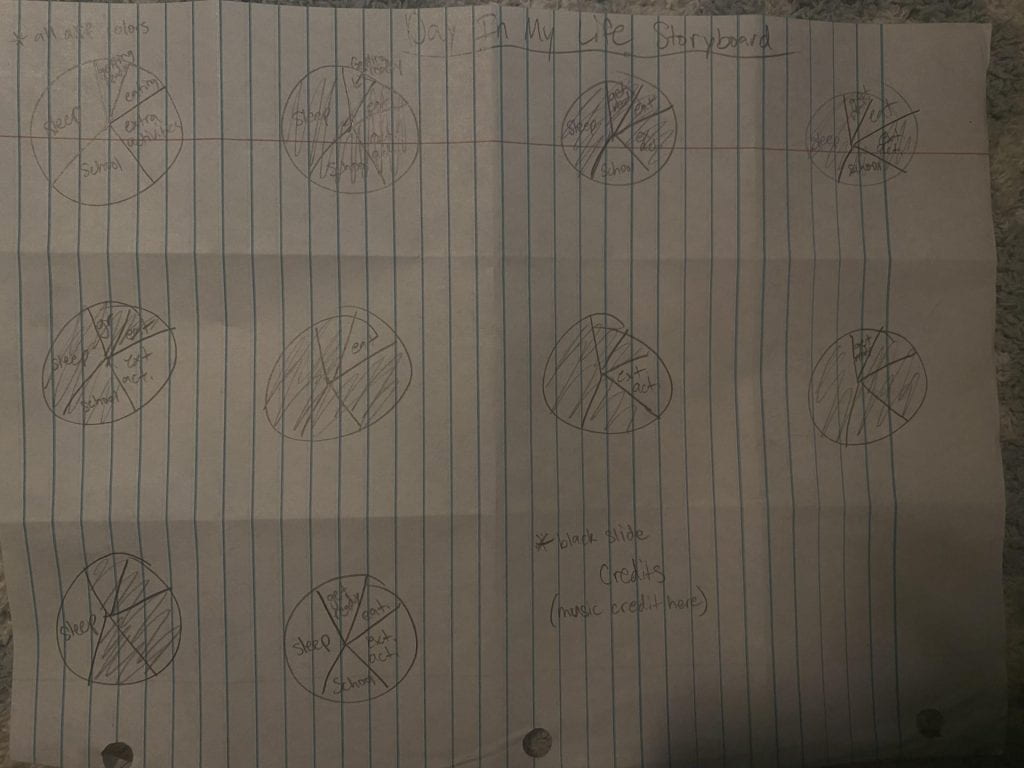
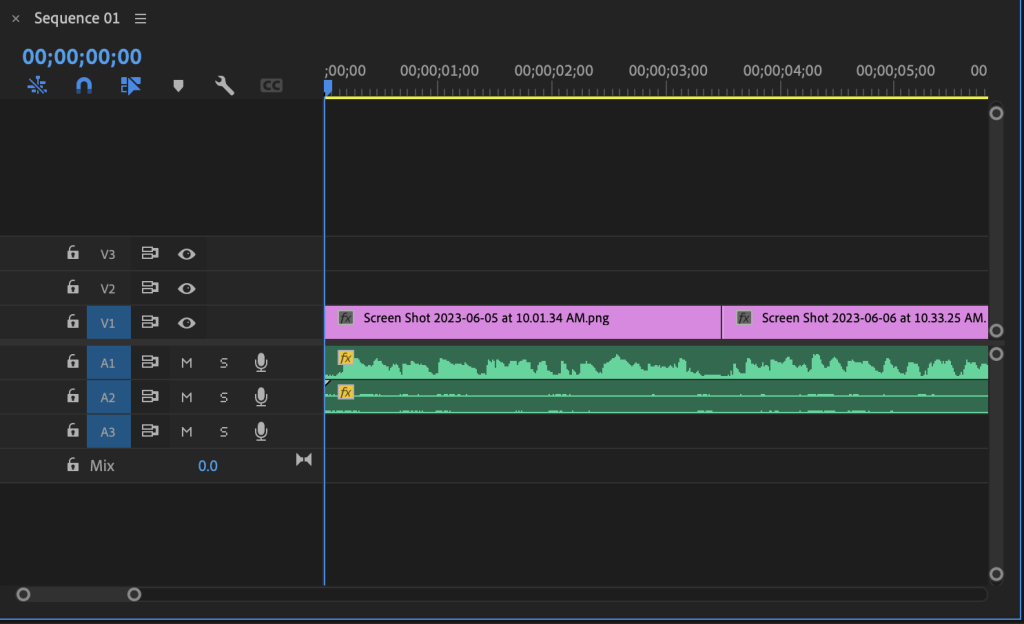
I started by writing down what I did in a 24 hour day on my phone. I then picked a font from 1001fonts and then I made a color palette from Adobe Color. I then made my pie chart using Adobe Illustrator with the font and color palette that I previously chose. I then wrote my script and recorded the audio and made a storyboard for my video. I made my video by first putting in screenshots of my pie chart, then my recorded audio, and then I picked a song to put in my video from open verse. I then adjusted the volume of the music and audio so that you could hear me talking about what I did in my life that day. Finally, I downloaded the video and put the link into my blog post.
Font
Color Palette

Pie Chart
Script
Hi! I’m Samantha and I recorded what I did for 24 hours in my life. The first thing I start my day with is waking up and getting ready for school. I spend about 1 hour getting ready for school. I’m at school for 6 hours, including driving to and from school. During school, I have a 30-minute break to eat food. Once school gets out, I have 1 hour of extracurricular activities and 1.5 hours of working out. Then, I get or make food which takes up to 1 hour. Then I hang out with people for 2 hours. I then go on my phone for about 30 minutes before taking a 30-minute shower. I was then on my phone for 1 hour to do things for college and watch Netflix before bed. Then it takes me 30 minutes to get ready for bed. I sleep on average 8.5 hours each night. Something I took from this study was that I should probably make time out of my day to eat breakfast. I was surprised that the time it takes me to get ready was equal to the time it takes me to eat in a day. Thanks for listening!
Audio Editing

Storyboard
Video Editing
The Documentary
https://drive.google.com/file/d/1U0U6P06_WGZPubXk_byVIC2iSvBpil_U/view?usp=sharing
What I Learned and Problems I Solved
I learned how to use voice memos on my phone and how to transfer it to premiere pro to edit.
At first, I had a hard time figuring out how to use Adobe Illustrator to make a pie chart but after a few attempts, I figured it out and it was actually pretty easy.
